AIA CAVS SIMULATOR CREATION
Composite Application
Validation System (CAVS) is part of the Application Integration Architecture Foundation
Pack and with CAVS you can test your SOA Composites like SOAPUI or the SOA
Test Suite.

Click “GO” in Composite Application Validation System.
1. Under Definitions, Click on Create Simulator.

2. Enter the Name of the Simulator(can be anything)

3. Paste the Complete SOAP- envelope request Message (which will be expecting from the Business Service(OSB)/Invoke Activity(BPEL) inside “<cavs:CAVSRequestInput_1>” .

4. Paste the Expected response below(Mock Response) inside “<cavs:CAVSResponseOutput_1> “.
And Click “Save and Next”.

5. In the Next page Click on Generate Xpath.
 6. After that we will be able to see Xpath Selection below the Expected Response Message.

Select any one as “Node Key”and Click “Save And Return”.
Once we Hit the CAVS from our Business Service, the Xpath will be compared with the Simulators and gives us the corresponding response.
Note :
CAVS URL to Invoke from Business Service/AIAConfiguration :
http://Host:Port/AIAValidationSystemServlet/syncresponsesimulator
Its really easy to change from Stub(CAVS) to actual endpoint with redeployment.
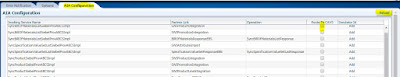
Goto AIA console:- http://Host:Port/AIA
 Click on AIA Configuration and enable/disable the checkbox. Then click on "Reload".

Click “GO” in Composite Application Validation System.
1. Under Definitions, Click on Create Simulator.

2. Enter the Name of the Simulator(can be anything)

3. Paste the Complete SOAP- envelope request Message (which will be expecting from the Business Service(OSB)/Invoke Activity(BPEL) inside “<cavs:CAVSRequestInput_1>” .

4. Paste the Expected response below(Mock Response) inside “<cavs:CAVSResponseOutput_1> “.
And Click “Save and Next”.

5. In the Next page Click on Generate Xpath.

6. After that we will be able to see Xpath Selection below the Expected Response Message.

Select any one as “Node Key”and Click “Save And Return”.
Once we Hit the CAVS from our Business Service, the Xpath will be compared with the Simulators and gives us the corresponding response.
Note :
CAVS URL to Invoke from Business Service/AIAConfiguration :
http://Host:Port/AIAValidationSystemServlet/syncresponsesimulator
Its really easy to change from Stub(CAVS) to actual endpoint with redeployment.
Goto AIA console:- http://Host:Port/AIA


